
Most retail traders look at the Forex market in terms of Forex pairs (the EURUSD, the EURJPY, or the GBPEUR). But how do you know which currency is the strongest or the weakest around the world at a certain time? The answer – the momentum meter indicator, also known as the forex momentum meter. This is how the banks look at the Forex market to identify the strength of FX pairs around the world.
This indicator is compatible with MetaTrader 4 (MT4) and there are also install instructions on how you can get started using it. And, even though, it is commonly used in the forex market, it’s also a great tool among investors to analyze stock prices.
So, in this article, we are going to explain everything you need to know about this momentum indicator and how you can use it when trading foreign exchange currency pairs.
First, How to Trade Currencies?
The first thing when people come into the Forex market is to look at the Forex pairs. To analyze these pairs and find good entry and exit points, most retail forex traders use a variety of technical analysis indicators. For example, some of the most popular indicators include the Relative Strength Index (RSI) which measures if an asset is overbought or oversold, the Moving Average (MA) which simply provide a buy signal or sell signal, and many more. Another way to analyze the market is by using Momentum indicators, which are technical analysis tools to determine the strength or weaknesses of assets.
A top bank trader, on the other hand, is not looking at the pairs. Instead, he/she is looking at the strength and weaknesses of individual currencies. And then, pitching that against the strength and weaknesses of other currencies.
Generally speaking, we trade 8 major currencies in the Forex market known as majors. If you cross-match these eight major currencies against each other, there are 28 different possible forex pairs to trade. The other 20 pairs are known as minors. Clearly, it’s totally logical to be buying the currencies that are strong and selling weak currencies.
For example, if both the pound and the US dollar are strong, why’d be trading the pound against the US dollar? They’re both strong currencies. It makes sense to buy one of these stronger currencies and find a weaker currency. Perhaps the Swiss franc or the yen and then sell that against one of the stronger currencies.
That’s what the big bank traders are doing, and that’s why they’ve got an edge over most retail traders.
The momentum indicator above can show you the difference between the weak and the strong currencies in the market at a certain point in time, and this how exactly how the big bank traders are doing it.
Momentum Indicator – How This indicator works?
Much like other indicators, the momentum indicator has its own settings and tools that you must understand before you start using it. Each individual line represents an individual currency in a standalone format, and you’ll find the color-coding down at the left.
For example:
- The green line is the USD
- The blue line is for the EURO
- The purple line is for the Canadian dollar
When you analyze the lines between them, it will tell you if a particular currency is stronger or weaker in relation to other currencies.
On the indicator chart below, you can clearly see that the British pound is a strong currency and it’s going up in value. The weakest currency in the basket of eight currencies is this red currency and based on the color code the red currency is the Swiss franc. That means the strongest currency at the moment is the British pound and the weakest one is the Swiss franc. In this case, you want to be buying the British pound and selling the Swiss franc to put the edge on your side. Further, you’ll be trading the market with a bearish signal for the Swiss franc.
Then, in the summary chart, the indicator will calculate if the currency values are strong or weak on all the different time frames, from the five minutes to the one day. A blue box at the side of the chart would indicate the currency is strong in that time frame and a red box would indicate the currency is weak in that period.
- A currency that’s blue across the board it’s a strong currency across all timeframes.
- A currency that’s red across the board will mean that’s weak across all timeframes.
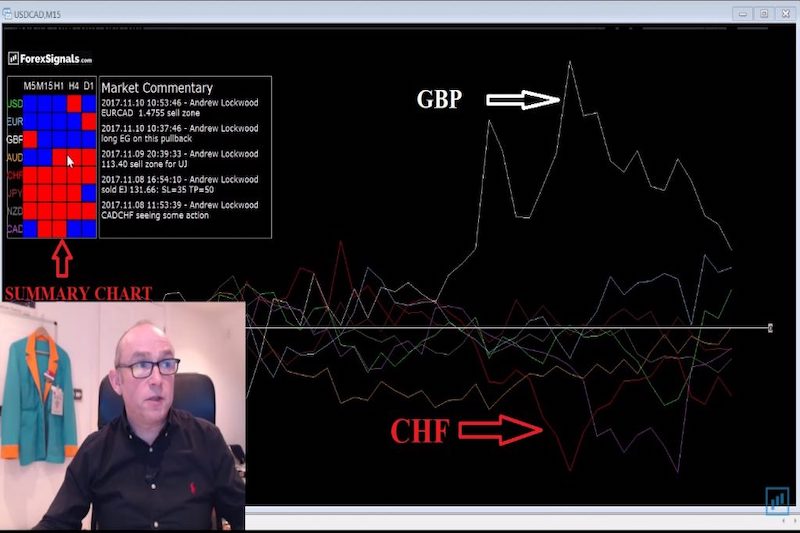
Now, let’s look at the price action chart. Once again, as you can see in the indicator chart below, the British pound is represented by the white line, against the red line, the Swiss franc. When you see a big buying momentum like the one below, it makes total sense to be buying the stronger currency and selling the weaker currency. In our case, if you want to get the edge on your side, you’d want to be buying the pound and selling the Swiss franc against it. In other words, you buy the GBP/CHF as the pair is expected to rise.
In general, you should always trade currencies that are diverging away from each other.
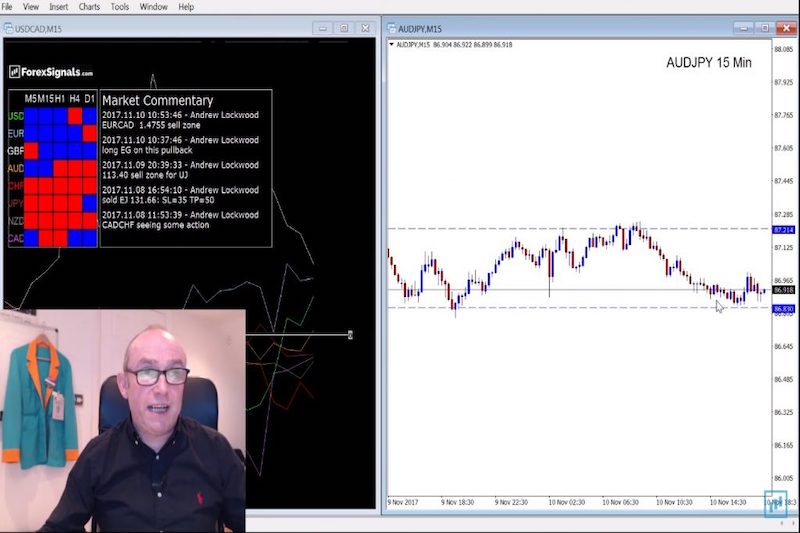
AUDJPY 15 min chart Momentum Indicators
Ranging Markets – Trade the Range
Another way to use this momentum indicator (much like the stochastic Oscillator indicator) is by looking for ranging markets. In the middle of the chart, you’ll see the orange line for the Australian dollar the brown line which is the Japanese yen. These are both hugging each other and they’re not doing too much.
This currency pair is trading in a very tight range. The momentum indicator will, therefore, indicate or show you currency pairs that are currently range trading. If you are a range trader this should really help you to control your account and monitor the market. Also, it is the ideal tool to determine what FX pairs you are going to trade and to measure the strength of a currency pair at a certain time frame.
The market commentary box is something that I use on a daily basis. I stream several times a day in the ForexSignals.com trading room and I’m trading a strategy called the Propulsion Strategy.
The Momentum Meter Indicator – How to Use It In Your Forex Trading?
This momentum indicator is giving me a heads-up on what currency pairs I should be trading with my strategy. As you have seen in this article, it is a great MT4 indicator to get reliable and effective forex trading signals. With this indicator, I’m populating this market commentary throughout the trading day, looking for setups, and telling you what trades I’m getting into and what I’m seeing in the market. And you can access this all through the ForexSignals.com trading room.
I hope the light bulb’s gone off for you, you’re now going to see the market in a completely different light. This is the way the big banks are looking at the market, finding a trend/direction in the forex market, and very often you might get a high level of accuracy. Simply put, it really gives you an edge in the market that most retail traders don’t even know is out there.
As always, if you liked this blog, leave a comment below. Until next time happy trading and good luck! I hope to see you in the Trading Room.
Try Live Forex Trading Room now for just 7 days free and gain access to:
- Daily Live Streams
- FX Trading Academy
- Tradeable Forex Signals
- Live Chat with All Members
- and much, much more!
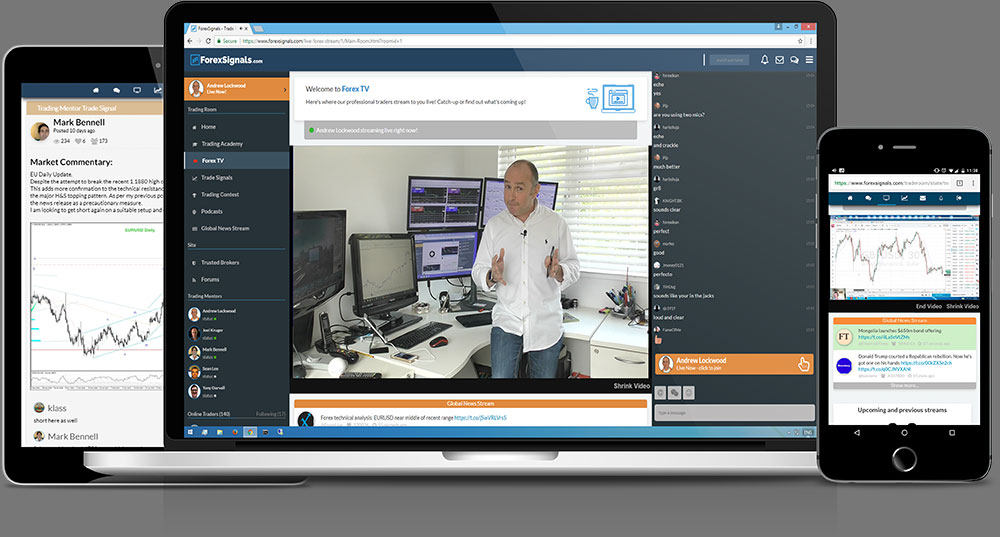
Join our Live Forex Trading Room now!
Become profitable trader with a help of our great community.
Daily Live Streams, Forex Signals and much more!