
There are multiple ways to trade forex markets. You could be a long-term position trader or a swing trader depending on the time frame and length of your trades. But, you can also be a scalper and use the Scalping strategy. For that matter, there are many scalping strategies including the 1-minute, and the 15-minute, and the most popular of all – the 5-minute scalping strategy.
In this article, we are going to learn a scalping strategy based on the 5-minute chart that has proven successful among day traders for the last few years. We’ll look at the exact levels of entry; when to buy, when to sell, and every other thing that you need to know to trade profitably in the forex market.
Let’s begin by looking at an outline of the 5-minute scalping forex strategy.
What is Scalping?
Before we delve into the details of showing you how to use the 5-minute forex scalping strategy, first, what does scalping actually mean?
Essentially, a scalper looks to scalp out small profits multiple times a day by using predefined trading strategies. Basically, what a scalper does is to quickly analyze the forex charts and then, mark the entry and exit levels with the goal of finding minor price changes in a certain asset – a process that is done several times within the day. Crucially, to get the best results and to ensure you limit the risks of this form of trading, scalping also involves the use of various risk management tools such as the risk-reward ratio, trailing stop-loss order, and the use of a forex risk calculator.
The 5-Minute Scalping Strategy – A 5-Step Guide
In the section below, we are going to show you a 5 step-by-step guide to one of the most widely used and effective scalping strategies out there, the 5-minute scalping trading forex strategy:
Step 1: Load and Anchor Chart and Identify Its Direction
The key premise behind this strategy is to trade only in the direction of the trend as we identify it. You need to go with the predominant trend while waiting for a smaller pullback. This is going to ensure that you only take the best trades and that you don’t get whipsawed back and forth. The idea here is to get into the market in a shorter time period as the market pulls back with the predominant trend as the direction of the trade.
As with any strategy, we always look at a higher time-frame chart.
For example; if you’re trading on the 5-minute chart, you have your confirmation chart which I basically call the “anchor chart.” An anchor chart is very important here, as it helps you to understand the direction of the trading.
Here, we’ll use the hourly chart (H1) as our anchor chart to dictate trading direction. This chart determines which way you are going to be trading; it helps you to know the best time to engage in buying or when you’re going to be selling.
On this chart, there are two exponential moving averages (EMA) – the 8 EMA and the 21 EMA. The direction of each moving average indicator is typically an indication of the direction of the market.
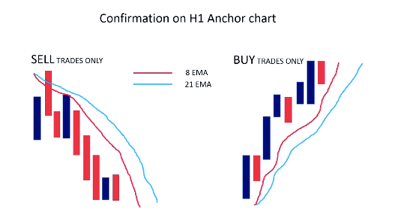
Scalping Strategy – Confirmation of H1 Chart
Keynotes:
- The candles represent the price action
- The lines represent the moving averages
Step 2: Learn how to Analyze the Anchor Chart
As already stated, the two EMAs on the H1 chart are the 8 EMA and the 21 EMA.
When the 8 EMA is below the 21 EMA with both pointing down and prices below both EMAs, then it means we’d be looking for the SELL trades only.
On the other hand, when the 8 EMA is above the 21 EMA with both up and price above both EMAs, then it implies that we’d be looking for BUY trades only.
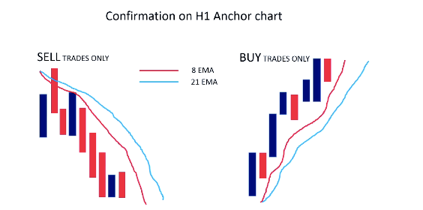
Scalping Strategy – 1 Hour Chart
Now, let’s look at a slightly different chart;
When the price crosses above the moving averages, it means that there is NO trade setting up. Again, when the price crosses below the moving averages, it also means there is NO trade setting up as seen below;
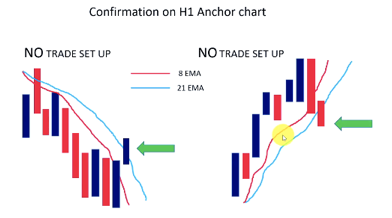
Scalping Strategy – Second Indicator
Remember, the price has to be on the right side in the direction of the trend.
Once we’ve confirmed the direction of the trend using the H1 confirmation chart, we can then move down to the 5 minutes chart. Let’s see a confirmed BUY trade only on the 5 minutes chart below;
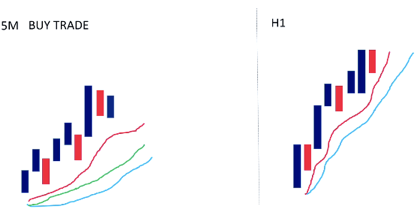
Scalping Strategy Confirmation 5 min and 1-hour charts
Step 3: Analyzing the BUY Trade on a 5-Minute Chart
On this 5-minute chart, there are three moving averages on the 5-minute chart; the 8 EMA, the 13 EMA, and the 21 EMA. Say, we have confirmed a BUY trade on the H1 chart, and have a nicely laid out 5-minute chart. As the price moves on, we now look out for a trigger. Any bar that touches the 8 EMAs becomes the ‘trigger bar’. When this happens, the next thing to do is to count back five candles previous to the trigger bar and look for the local swing high as seen below;
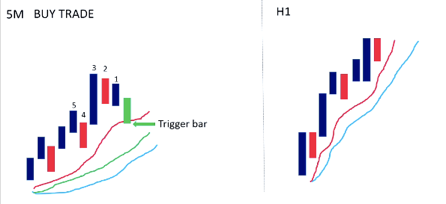
5-minute Scalping Strategy – Trigger Bar
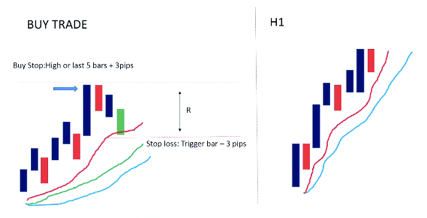
Scalping Strategy – Set a Buy Stop
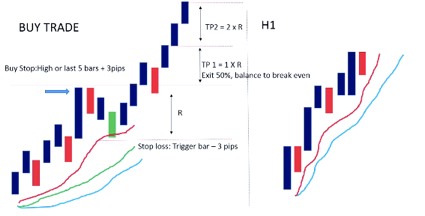
Now, we can put in our first take-profit target TP1 to be (1 x R).
Say, the prices move up to our first take-profit target where we exit 50% of the trade, and we move the balance to the trade’s stop loss (SL).
Then, we can put in our second profit target to be (2 x R) as we expect the price to move further up.
Scalping Strategy – Finding a Direction
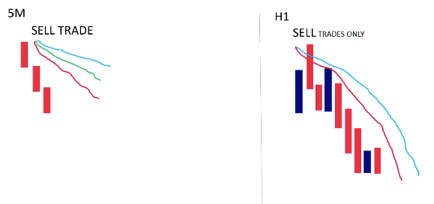
Step 4: Analyzing the SELL Trade on a 5 Minutes Chart:
On the H1 chart below, you can see that the price action is well below both moving averages showing a potential sell trade. On the 5 minutes chart, the moving averages are well fanned out, which is certainly a sell signal in this trading strategy.
5-minute Scalping Strategy – analyzing the sell
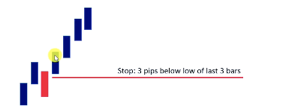
Here, we are looking for a pullback to the 8 EMA. That becomes our trigger bar. Now, we count back five bars (or candles) to figure the lowest low. We then count three pips below the lowest bar to form our sell stop. Once we have established where to enter the trade, we know where we are going to be placing our stop-loss, three pips above the trigger bar. The distance forms our initial risk (R).

Scalping Sell Trigger Bar
Once we know our initial risk, we can place our first take-profit target TP1 – (R x 1). And as the price moves down, take out the first profit target, exit half the position, and move the stop loss of the trade to break even. After that, we can put in our take profit target 2 TP2 – (R x 2) and then wait for the price to move further down to take the profit target 2 as well.

Scalping Take Profit Target
In order to gain confidence in this strategy before taking it into the live markets and trading with real money, I encourage you to do some backtesting!
Note: Another way I encourage you to excel in this forex strategy is to use a trailing stop, which is a type of order available on some trading platform that enables you to trail behind a price, and therefore, allows you to be in the trade for much longer if the trend, indeed develops into a much stronger move.
Step 5: Know When to Exit
Now, with this method, there are two possible ways you can exit the market;
- Exit the 50% at TP1 and
- Exit the second 50% with a trailing stop-loss
Exit the 50% at TP1

Scalping Strategy Exit Level
Here, as the price moves up, we simply place the profit target at 50% and move the stop-loss to breakeven once the level is reached. As the stop-loss is set to break even, we are going to be a risk-free trade from now on, with 50% of the initial position size.
Exit the second 50% with a trailing stop-loss
In using a trailing stop-loss, we are going to be trailing behind the low of the previous three candles, i.e., the lowest low of the three candles. As the price moves up, we count back the three previous candles and the stop moves three pips below the lowest point of those candles. In this instance, the stop is trailing behind the third candle low as shown below;

Scalping Trailing Stops 1
Scalping Trailing Stops 2
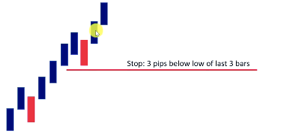
Scalping Trailing Stops 3

Scalping Trailing Stops 4
Finally, as it pulls back down, the stop-loss, which is now in profit is hit and we exit the second half of the trade, the remaining 50%. This way, we are kept in the market far longer and taking much more out of the market trailing behind the third candle; the third candle low in the case of a buy and the complete reverse if you’re selling as you will be trailing behind the third candle high with a buffer of 3 pips high.

Scalping Take Profit
The Bottom line – How to Use the 5-Minute Scalping Strategy in the Foreign Exchange Market?
Now, as with any forex strategy that you wish to deploy in the foreign exchange market, our investment advice is that do some backtesting first. Backtesting helps you to know how the strategy performs so that you’d be more equipped and more confident when you trade with real money. Thus, it is advisable that you first open a demo account and backtest the 5-minute strategy above with virtual money. Other than that, if you seek advice for improving your chances in your trading journey, you can try different services including trading mentoring programs, independent financial advisors, or social trading systems.
At last, you might want to consider the risks involved in getting into the forex market by using this trading system. In other words, usually, there’s a long learning curve when trading currencies with this strategy so you might want to take into account the possibility of having a losing trading performance for the first months of trading. But, once you master your scalping trading skills, you’ll see it is one of the most profitable methods among investors and traders.
So there it is. Our 5-minute scalping Strategy. Try it and let me know how your backtesting will go. I’d be thrilled to hear your input!
Try Live Forex Trading Room now for just 7 days free and gain access to:
- Daily Live Streams
- FX Trading Academy
- Tradeable Forex Signals
- Live Chat with All Members
- and much, much more!
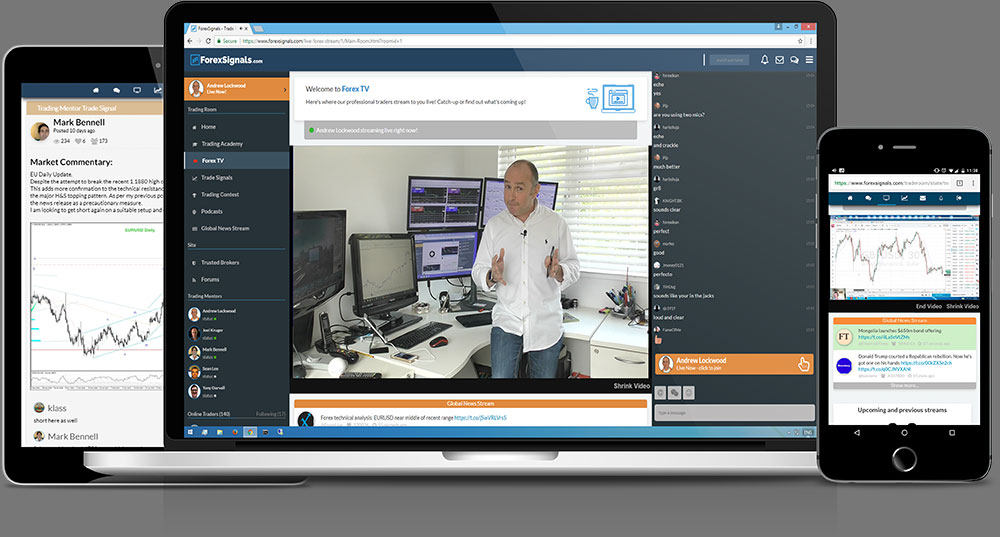
Join our Live Forex Trading Room now!
Become profitable trader with a help of our great community.
Daily Live Streams, Forex Signals and much more!