

There are lots of technical analysis indicators to choose from including the Relative Strength Index, Moving Average (MA) Bollinger Bands, and many more. But, drawing support and resistance levels in a chart is certainly one of the most useful tools to effectively find entry and exit points as a trading strategy.
So, for those of you who don’t know, here’s a straight-to-the-point crash course on what support and resistance levels and how you can find support and resistance lines in a chart.
What Are Support and Resistance Levels?
Firstly, let’s look at a good example of a well-defined level of resistance level on the GBPUSD chart:
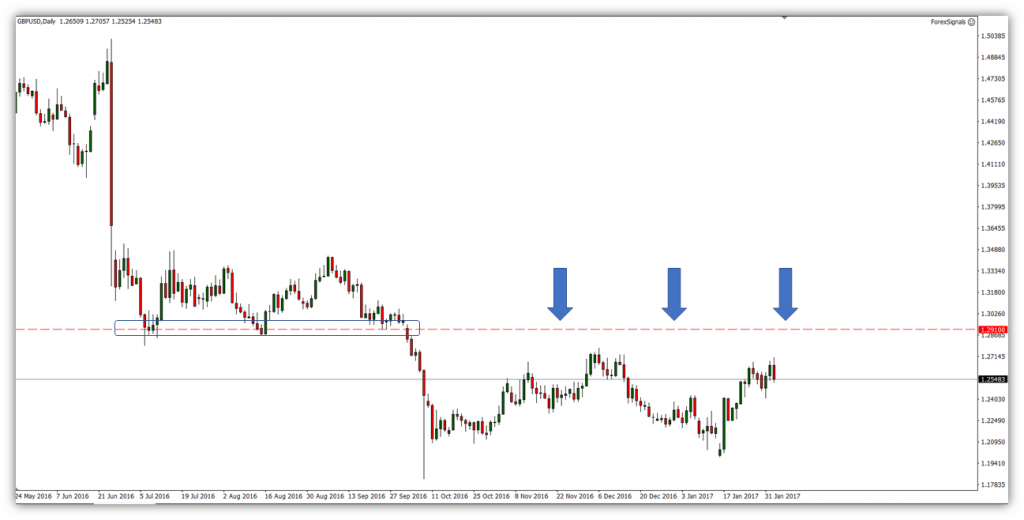
This is the most recent (relative to the time of this post) chart from the GBPUSD pair. Every ‘Tom, Dick and Harry’ around the world will be aware of this level @ 1.29 – 1.29100 (‘dog zone’).
A day trader will refer to a price action level as resistance if the price is either revisiting a level that has been challenged before or like the example above, is now coming up to ‘check’ old support. In the example above on GBPUSD, if the price rotates back up toward this price level at 1.29-.1.291, then we can consider this as the 1st touch of resistance zones. This is because of the old major support (which is highlighted in the blue box) and that price is bullish into the level. If the price was bearish into a level of equal significance like this, then we’d refer to it as a support level (again, like what we’ve seen outlined in the blue box).
Support and resistance levels are an intrinsic part of any financial market. They’re defined by market participants (you and me) and are levels in which supply and demand (aka order flow) rapidly shift. It’s the level where the bulls and bears collide and as an aggregate, the winning side prevails. It’s a price where the market is almost in a submissive or reactive point as buyers or sellers yield to their counterparties.
Consequently, experienced traders often use support and resistance areas as a trading strategy in a ranging market – meaning you always buy the asset when the price reaches the horizontal support level and sell the asset when the price moves closer to the resistance level. But the twist is that once the price tests these psychological levels and eventually breaks above or below the support and resistance price levels, you may expect a change in price action -an upward or downward trend in the market. Then, in case the price breaks above support and resistance, you should be trading the trend.
Why Are Support and Resistance Levels Useful to Your Trading?
In the example on GBPUSD above, knowing that 1.29 – 1.291 was previously significant support, we’re able to set ‘traps’ in anticipation that if GBPUSD revisits this level, we’re ready to react. Said another way; we’re wanting to be aware of key potential turning points to minimize the risk and maximize our reward as much as possible. What I’m referring to here in trading is known as “R multiples” but that’s for another article.
If we can highlight a major level of support or resistance, then we can identify support and resistance levels and know where an optimal entry point in the market is. As this is a discretionary process, we need to be aware of a few things when considering a level as significant or not. This is because although this is not a clear science, we can still acknowledge some fundamental logic.
How to Find Support and Resistance Levels?
Let me lay down the broad rules and the key concepts for finding support and resistance levels from what I’ve observed over nearly 10 years in Forex:
- Price doesn’t turn on a dime. They’re not precise levels but instead ‘ranges’ or ‘zones’
- Higher the time frame, the more reliable (a weekly chart is recommended)
- The more a level is ‘checked’ in quick succession, the more probable it is to break
- ‘Distance makes the heart grow fonder’ – If price repels from a significant level for a long period of time, that constant level becomes more significant to pierce on the first revisit.
- Spacing from each peak/trough is important
- Focus more on the close price of each bar when evaluating a level
- Support and resistance levels are more likely to break during higher liquid times of the day.
- Whole numbers hold more interest – e.g. 1.2300 / 1.2000 (Carol Osler Ph.D. wrote an engaging publication on the micro-structure of the Forex market). A round number could be used as a stop loss or take profit.
- Resistance and support levels are an excellent way to trade ranging markets.
Generally, what can make your life easier in finding these levels is to look at the “line graph” on MetaTrader 4 trading platform. This will show you all the close prices of each bar. Then, you simply need to learn how to insert horizontal lines into a chart in different time frames and identify areas of support and resistance levels. On the same note, another useful method for many traders is to find support and resistance levels by using Fibonacci retracement levels. If you are not familiar with this indicator, Fibonacci levels are fixed support and resistance levels from the lowest point to the highest point in a certain time frame (Fibonacci sequence – 23.6%, 38.2%, 61.8%, and 78.6%).
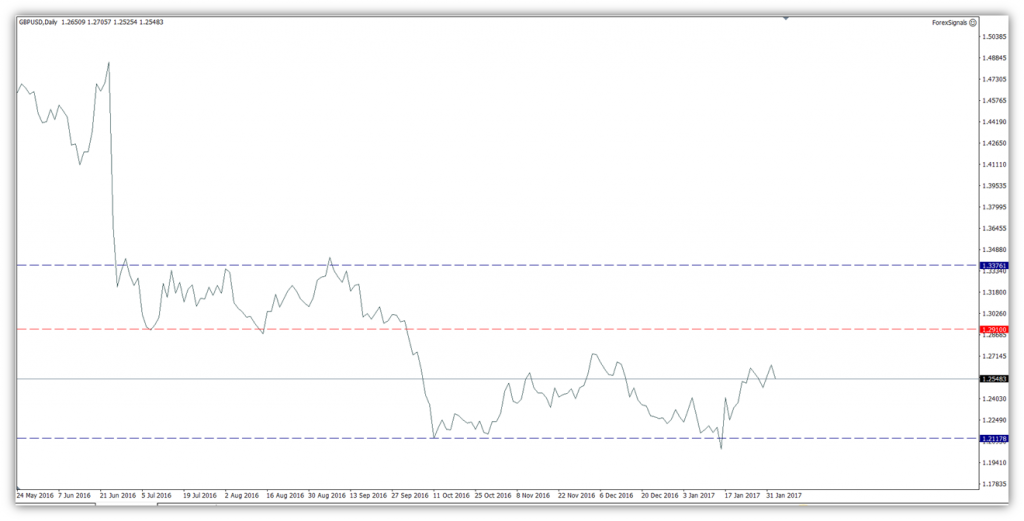
Again, this is the daily time frame on the same GBPUSD chart. You can see that I am not looking for perfect levels where the price has turned on a dime but I am roughly conforming to the broad points above.
Get into the routine of drawing significant and clear levels of support and resistance. This technical analysis tool not only serves you in being aware of ‘hurdles’ or levels in which price may struggle, but more importantly how you can be prepared to trade these levels if and when price revisits them, and thus, make better trading decisions. It is a common strategy for many traders, particularly for those who typically trade with fixed chart patterns. The only thing that is left for you to do is to methodologically learn to identify support and resistance levels and insert horizontal lines into your trading platform.
Trading (and especially day trading) is all about planning and preparation. Fail to plan, plan to fail.
Try Live Forex Trading Room now for just 7 days free and gain access to:
- Daily Live Streams
- FX Trading Academy
- Tradeable Forex Signals
- Live Chat with All Members
- and much, much more!
Join our Live Forex Trading Room now!
Become profitable trader with a help of our great community.
Daily Live Streams, Forex Signals and much more!